
Every recruiting team gets asked the same question sooner or later: are we hiring fast enough?
The answer depends on three things most benchmark articles skip. Which metric you're measuring, what kind of role you're filling, and which stage of your process is eating the time. A benchmark can tell you whether you're slow. Only your own stage-by-stage data can tell you why.
This guide covers the current benchmarks for average time to hire and time to fill, how they vary by industry, stage, and company size, the factors that drag timelines out, and the metrics that show you where to fix them.
Time to hire vs. time to fill
These two terms get used interchangeably, but they measure different things, and mixing them up makes any benchmark comparison meaningless.
Time to fill is the number of calendar days from when a job requisition opens to when a candidate accepts the offer. It covers your whole process, including internal approvals and getting the job posted. This is the metric SHRM uses in its benchmarking research.
Time to hire usually starts later, when the eventual hire enters your pipeline by applying or being sourced, and ends at offer acceptance. It measures how quickly your team moves a specific candidate once you've found them.
The gap between the two is diagnostic. If time to fill is long but time to hire is short, your problem is upstream: approvals, posting, or finding candidates. If both are long, the slowdown is inside your evaluation process.
Before comparing yourself to any number in this article, check which definition it uses, and whether it counts calendar days or working days. A 30 working-day figure is roughly six weeks on the calendar.
What is the average time to hire in 2026?
The most reliable current benchmark comes from SHRM's recruiting benchmarking research, which draws on data from more than 4,600 organizations across industries and sizes.
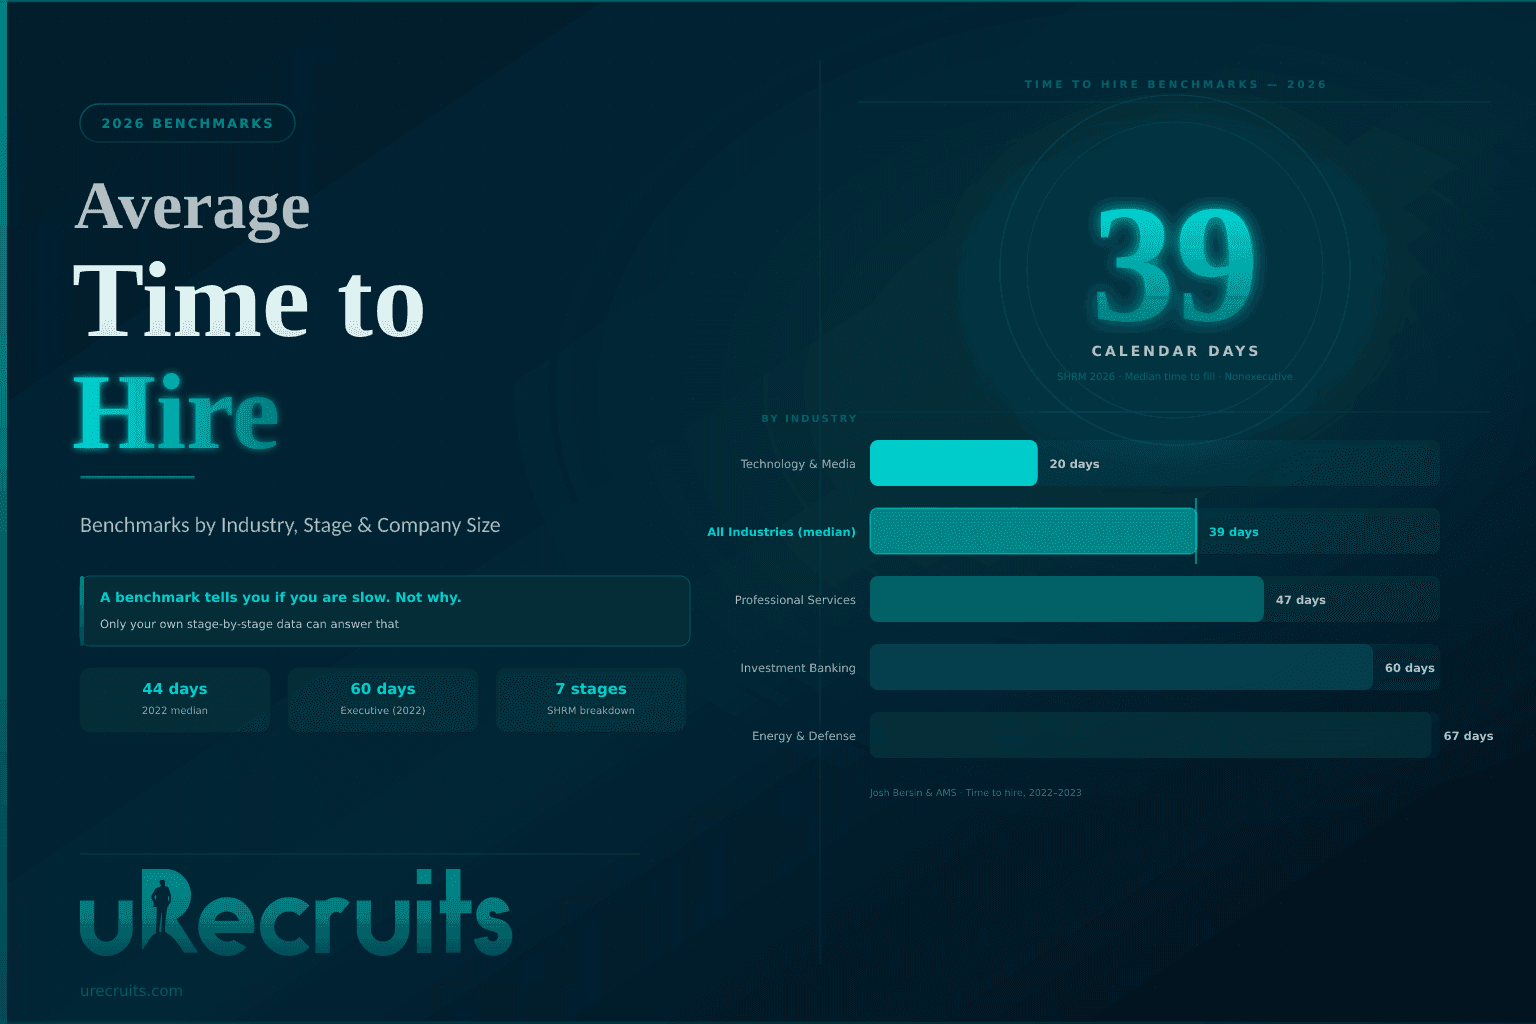
In SHRM's 2026 Recruiting Executives Benchmarking brief, the median time to fill for nonexecutive positions fell to 39 calendar days. SHRM reports the executive median as unchanged from the prior year, and its 2025 research put both executive and nonexecutive medians at roughly a month and a half. For contrast, SHRM's 2022 benchmarking report recorded 44 days for nonexecutive roles and 60 for executive roles.
SHRM's own 2026 trend coverage frames AI's effect carefully. In it, Eleesha Martin, director of corporate recruiting at G&A Partners, put it this way: "AI will free up recruiters and HR pros to focus on things outside transactional work." That's capacity, not necessarily speed. A cooler labor market also changes how quickly candidates accept and how many options they're weighing, so don't read the faster median as an AI result on its own.
Keep two things in mind about this number. It's a median, so half of organizations are slower. And it blends every role type together, so 39 days tells you very little about how long a registered nurse or a senior engineer should take.
| Benchmark | Nonexecutive | Executive | Source |
|---|---|---|---|
| 2026 median time to fill | 39 days | Unchanged from 2025 | SHRM 2026 Recruiting Executives Benchmarking |
| 2025 median time to fill | Roughly a month and a half | Roughly a month and a half | SHRM, State of Recruiting 2025 |
| 2022 median time to fill | 44 days | 60 days | SHRM 2022 Benchmarking Report |
All figures are calendar days, from requisition opened to offer accepted. SHRM publishes the 2026 executive figure and the exact 2025 medians in its members-only report.
Average time to hire by industry
A single national average hides big differences between sectors. The broadest cross-industry dataset comes from the Josh Bersin Company and AMS, whose Talent Climate: Time to Hire Benchmark Factbook analyzed about a quarter of a million hires across 2022 and early 2023. It measures time to hire, not time to fill, and the data is now three to four years old, so use it for the relative gaps between sectors rather than as a 2026 target.
| Industry | Average time to hire (days) | Source and period |
|---|---|---|
| Tech and media | About 20 | Bersin and AMS, first half of 2022 |
| All industries, global | About 43 to 44 | Bersin and AMS, Q1 2023 |
| Professional services | 47 | Bersin and AMS, period not stated |
| Investment banking | 21 to more than 60 | Bersin and AMS, range |
| Energy and defense | More than 67 | Bersin and AMS, 2022 |
Why some industries take longer
The ranking isn't random. The slowest industries share a few traits.
Specialized talent pools. Energy and defense, and professional services, compete for a narrow group of experienced people, most of whom already have jobs. Bersin and AMS attributed the highest rates to "the specialization of roles and small talent pools available."
Credentials, clearances, and compliance. Roles that need licenses, security clearances, or regulatory checks carry steps that run on their own clock, which is especially true for clinical healthcare and defense roles.
More decision-makers. Senior and client-facing professional services roles often involve more interviewers and more sign-offs.
Volume hiring. Hospitality, retail, and food service are commonly reported at the fast end because roles are higher volume, candidate pools are larger, and evaluation is usually simpler.
The practical lesson: if you hire in a slow industry, comparing yourself to an all-industry average will make you look worse than you are. Compare against your own sector and role type.
Average time to hire by stage
This is where the real answers are.
SHRM's benchmarking breaks time to fill into seven stages, and its 2022 report published a median number of days for each stage of nonexecutive hiring. The figures are a few years old, but they are the most detailed public stage data available, and the shape of the problem they show hasn't changed.
| Stage | Median days (nonexecutive; SHRM 2022 Benchmarking Report, data collected April to November 2021) |
|---|---|
| Position opened to approved to fill | 7 |
| Approved to job posted | 2 |
| Job posted to screening started | 5 |
| Screening applicants | 5 |
| Conducting interviews | 7 |
| Final decision and offer extended | 4 |
| Offer to acceptance | 2 |
Stage medians don't add up to the overall median, because each is calculated across different organizations. What the table shows is where the time goes.
The first three stages happen before a single candidate is evaluated. In SHRM's 2022 data the three medians total 14 days, roughly the 12 for screening and interviewing combined, even though stage medians are not additive. That's dead time from the candidate's point of view, and it's often where long time-to-fill numbers come from.
The only way to know which stage is costing you time is to timestamp every transition. In uRecruits, every role runs on a configurable uR Position Workflow with a pipeline view by stage, and every action is logged with an actor and a timestamp, so the stage history is recorded as candidates move rather than reconstructed later.
Time to fill by company size and seniority
Company size
Larger organizations often report longer timelines, and SHRM's 2026 data points at one likely reason: extra-large organizations saw a 67% increase in median requisitions per recruiter. For context, SHRM's 2022 report put the median at 20 requisitions per recruiter across organizations with dedicated recruiters, with a quarter handling 6 or fewer and a quarter handling 50 or more. More requisitions per recruiter, plus more approval layers, tends to mean longer timelines. SHRM publishes its size-by-size time-to-fill medians in the members-only report.
Seniority
The historical rule was simple: senior roles take longer. That gap has narrowed. In SHRM's 2022 data, executive roles took a median of 60 days against 44 for nonexecutive roles, 16 days longer. By 2025, SHRM reported both at roughly a month and a half. In 2026 the nonexecutive median fell to 39 while the executive median held, so the gap reopened.
SHRM's 2026 brief says executive cost per hire "has increased substantially"; the 2022 median was $8,750. In its 2025 analysis, SHRM suggested organizations may be investing more to expedite hiring for critical roles. Within any single organization, senior roles still usually take longer than entry-level ones, because the candidate pool is smaller and more people are involved in the decision.
Factors that extend time to hire
Most slow hiring comes down to a handful of causes, and very few of them have anything to do with the candidate market.
Approval delays. Requisitions wait on a budget owner or a second sign-off, and offers wait on compensation approval. Nothing about the talent market causes this.
Too many interview rounds. Every extra round adds scheduling time and another chance for a strong candidate to accept an offer elsewhere. Rounds that repeat what an earlier round already tested are the first to cut.
Interview scheduling. Coordinating calendars across several interviewers is one of the most common sources of slippage, and the days lost between rounds add up quickly.
Unclear or inflated job requirements. Vague job descriptions attract the wrong applicants and lengthen screening, while unnecessary requirements shrink the pool of people who qualify.
A thin candidate pool. When every role starts from zero, sourcing takes as long as it takes. Teams with an engaged talent pool skip much of that wait.
Decision lag. The gap between the final interview and a decision stretches when nobody owns closing the loop and feedback arrives late.
Slow or complicated offers. Unclear compensation, several layers of offer approval, or a long acceptance window all extend the final stage.
Is a faster time to hire always better?
No. Speed is only good if quality holds.
A process that's too short can skip evaluation steps that would have caught a poor fit. A process that's too long loses strong candidates to faster competitors and damages candidate experience. The goal is to remove waiting, not evaluation.
That's why time to hire should be read alongside quality of hire. In SHRM's 2022 benchmarking, only 27% of organizations measured quality of hire at all. SHRM's 2026 data adds that small and extra-large organizations were slightly more likely to measure it than midsize and large ones, so the gap isn't simply about resources. If you speed up hiring without tracking whether the people you hire succeed, you can't tell whether you've improved anything.
A useful rule of thumb: cut time spent waiting between stages first. Cut time spent evaluating last, and only with evidence it isn't hurting outcomes. That's also how uRecruits approaches AI. Under Governed Autonomy™, AI recommends and you decide, and the platform makes zero automated hiring decisions, so speed comes from removing waiting rather than removing people from the decision.
How to reduce your time to hire
1. Measure every stage, not just the total
A single time-to-fill number can't show you where the days went. Timestamp each stage transition and review where candidates stall, by role type and by hiring manager.
uRecruits HR Insights reports open and closed roles by status and date, shows which jobs are moving and which are stuck, and tracks time metrics across interview and offer stages, with export to your BI tools if you want to go deeper.
Metrics worth tracking:
- Stage-to-stage time. The average number of days candidates spend in each stage before moving on, starting with the interview and offer stages HR Insights tracks today.
- Stuck roles. Open roles with no candidate movement over a set period.
2. Clear approvals before the role opens
Agree headcount plans and compensation bands in advance so a role can open the day it's needed, and so the offer doesn't wait on a fresh approval at the end.
Metrics worth tracking:
- Requisition approval time. Days from requisition created to approved.
- Offer approval time. Days from the hiring decision to the offer being cleared to send.
3. Build a talent pool before roles open
Candidates you've already engaged can move straight into evaluation, skipping most of the sourcing wait. Keep people who were strong but not chosen, past applicants, and referrals warm so the next role starts from a list rather than a blank page.
uRecruits Talent CRM lets you source candidates into a talent pool that compounds over time and convert someone to an applicant with one click when a matching role opens. The ATS and Talent CRM share the same candidate record, so nobody gets re-entered.
Metrics worth tracking:
- Share of hires from your talent pool. How many roles you fill from people you'd already engaged.
- Time to first qualified candidate. Days from a role opening to someone credible reaching the hiring manager.
4. Tighten screening and interviews
Screen early, cut rounds that repeat each other, and take the back-and-forth out of scheduling. A job-related assessment early in the process can give the team useful evidence before anyone spends interview time.
In uRecruits, the Scheduling Agent in uR Agent™ books interviews in chat and sends a real Google or Outlook calendar invite once you confirm, and the platform connects to Gmail, Outlook Email, Google Calendar, and Outlook Calendar. Candidate Assessments covers live coding, take-home tests, and domain-specific evaluations, with results synced to the candidate record and Scoreboard.
Metrics worth tracking:
- Application-to-screen time. Days from a candidate applying to their first review.
- Screen-to-interview conversion. The share of screened candidates who move to interviews. A very low rate usually points to a targeting or job description problem.
- Interview loop duration. Days from the first interview to the last.
5. Set feedback and decision deadlines
Agree with hiring managers on how quickly feedback is due after each interview and how quickly a decision follows the final round. Make one person responsible for closing the loop.
Metrics worth tracking:
- Feedback turnaround. Hours or days from an interview ending to feedback being submitted.
- Final interview to offer. Days from the last interview to an offer going out.
6. Keep candidates informed through the offer
Regular updates reduce drop-off while a decision is pending, and a clear, fast offer protects the time you've already invested.
Metrics worth tracking:
- Offer acceptance rate. The share of offers accepted. A falling rate can mean your process is too slow or your offers aren't competitive.
- Candidate drop-off rate. The share of qualified candidates who withdraw mid-process.
Benchmarks are a starting point, not a target
A benchmark answers one question: compared with similar organizations, are we slow? It can't tell you why, and chasing a number without understanding the cause usually just moves the delay somewhere else.
Start with the right comparison for your industry, role, and size. Then measure every stage of your own process, find the one where candidates wait longest, and fix that first. Repeat. That's how time to hire comes down without quality of hire going with it.
See where your hiring time goes
If you want stage-level visibility without stitching together spreadsheets, uRecruits brings your pipeline, scheduling, assessments, and reporting into one connected workflow, with every hiring decision staying with your team. Book a demo or start a 14-day free trial, no credit card required.
Frequently asked questions
What is the average time to hire in 2026?
SHRM's 2026 benchmarking data puts the median time to fill at 39 calendar days for nonexecutive positions, measured from requisition opened to offer accepted, with the executive median unchanged from 2025. Time to hire, measured from when a candidate enters the pipeline, is typically shorter.
What is the difference between time to hire and time to fill?
Time to fill runs from when a requisition opens to when a candidate accepts an offer, so it includes approvals and posting. Time to hire usually starts when the eventual hire enters your pipeline and ends at offer acceptance, so it measures how quickly you move a specific candidate.
Which industries have the fastest and slowest time to hire?
In the Josh Bersin Company and AMS benchmark data from 2022 and early 2023, tech and media hired fastest at around 20 days, while professional services ran at 47 days, investment banking ranged from 21 to more than 60, and energy and defense took more than 67 days. The researchers linked the slowest sectors to specialized roles and small talent pools.
What are the stages of the hiring process for measuring time to hire?
SHRM breaks time to fill into seven stages: requisition opened to approved, approved to posted, posted to screening started, screening, interviewing, final decision and offer, and offer to acceptance. Measuring each stage separately shows where your process is losing time.
What is a good time to fill?
It depends on the role, industry, and company size. SHRM's 2026 median of 39 days is a reasonable reference for nonexecutive roles overall, but specialized and highly regulated roles will take longer. The more useful goal is improving on your own baseline for each role type.
How do you calculate average time to hire?
For each filled role, subtract the date the candidate entered your pipeline from the date they accepted the offer. Add those numbers together and divide by the number of hires. For time to fill, use the requisition open date instead of the pipeline entry date.
How can I reduce my time to hire?
Start by measuring how long candidates spend in each stage, then fix the slowest one. The most common wins are clearing approvals before a role opens, keeping a warm talent pool, cutting duplicate interview rounds, automating interview scheduling, and setting deadlines for hiring manager feedback.
Why does hiring take longer at large companies?
Two common reasons are more requisitions per recruiter and more approval layers. SHRM's 2026 data found extra-large organizations saw a 67% increase in median requisitions per recruiter, and approval and posting stages happen before any candidate is evaluated, so every extra sign-off adds days.
Does reducing time to hire lower quality of hire?
It can if you cut evaluation steps. It usually doesn't if you cut waiting time between stages, such as approval delays, scheduling gaps, and slow decisions. Track quality of hire alongside time to hire so you can tell the difference.
Benchmarks in this article reflect published research as of October 2026: SHRM's 2026 Recruiting Executives Benchmarking brief, SHRM's State of Recruiting 2025 insights, SHRM's 2022 Benchmarking Report, and the Josh Bersin Company and AMS Talent Climate: Time to Hire Benchmark Factbook (June 2023). Medians vary with survey sample, methodology, and labor market conditions. Product capabilities described reflect urecruits.com as verified in September and October 2026.
Subscribe Now
Get the latest hiring insights delivered to your inbox.